If you look at a city map, you will find shapes drawn to separate one city from another, and these shapes that you are looking at are polygons. Polygons are digital shapes that define areas on the Earth’s surface. They can represent anything from a city block to a building outline, a land parcel, or a protected watershed. This guide outlines
- What polygon data is and its components
- The process of building a polygon and its importance
- The application of polygons in various real-world contexts
So let’s start by understanding more about what polygon data is.
What is polygon data?
Polygon data is a geographic data format that stores shapes defined by a closed sequence of vertices.
For example, a list of latitude-longitude points might represent a city boundary. When these points connect back to the starting point, they form a complete outline. It’s similar to forming a shape by joining a series of dots on a map. When you return to the first dot, you’ve created a polygon.
Each polygon forms a distinct, measurable area. With its coordinates, GIS tools can calculate dimensions, verify point locations, assess spatial relationships, and drive advanced geographic analysis.
What is a polygon in GIS?
In geographic information systems (GIS), polygon data is paired with attributes that describe each area, such as parcel ID, land use, or zoning category. They support spatial analysis, allowing GIS tools to measure area, identify what lies within or overlaps, and link descriptive polygon attributes. These spatial analyses make it possible to answer questions such as “Which parcels are zoned for residential use?” or “What is the total area of building footprints in a neighborhood?”
Let’s take a polygon layer representing property parcels in a city. Each polygon outlines the exact boundary of a parcel and includes polygon attributes like:
- Parcel ID: 1023-B
- Land Use: Residential
- Zoning: R2
- Building Area: 1,850 sq ft
With this combination of polygon geometry and attributes, GIS can filter for all polygons zoned R2, count the number of residential parcels, sum the total building area within a neighborhood, or check whether a specific address falls within a parcel’s boundary.
Key components of a polygon in GIS
Polygons in GIS are built on several core components that altogether ensure that spatial features are accurately represented, described, and analyzed:
Polygon geometry: These are technical structures that define how a polygon is drawn. It points out the exact points that outline a polygon and connects them in the right order to form its shape and boundaries.
Polygon attributes: These attributes provide descriptive information for each polygon, such as IDs, names, land-use categories, or other demographic details that make the spatial feature meaningful.
Topology: It tells the spatial relationships between polygons, which include adjacency, containment, connectivity, and overlap. These understandings enable the modeling of interactions and the maintenance of data integrity.
Projection: It is the coordinate reference system or map projection that specifies the way that polygon geometry corresponds to the Earth’s surface so that all maps and datasets are consistent and accurate.
What are the types of polygon data?
Polygon data comes in many forms, each designed to represent a different kind of area on the map. Let’s take a look at some of these types:
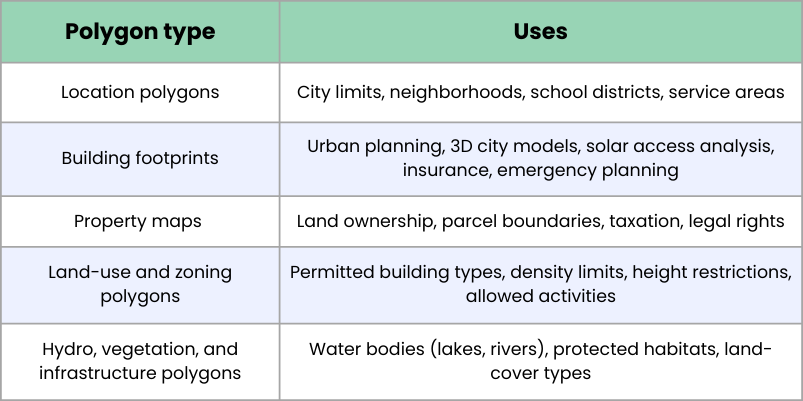
Location polygons: These polygons show governance or service boundaries and have legal, political, or operational meaning. It includes administrative divisions, such as:
- City limits
- Neighborhoods
- School districts
- Service areas
Building footprints: A building footprint polygon traces the outline of a structure’s ground footprint and emphasizes the physical structure. This is crucial for urban planning, 3D city models, solar access analysis, insurance, and emergency response planning.
Property maps (parcels/tax lots): Parcel polygons delineate land ownership and parcel boundaries. A parcel polygon is neither a building nor an administrative district. It represents:
- Who owns the land
- What boundaries define the lot
- Taxation and legal rights
Land-use and zoning polygons: These polygons classify land by permitted uses and define rules, such as:
- What can be built
- Density limits
- Height restrictions
- Permitted activities
Hydro, vegetation, and infrastructure polygons: Water bodies (e.g., lake boundaries), protected habitats, and land-cover types can be represented as polygons. These are natural or physical features, unlike the human-made categories mentioned above.
What is the polygon in GIS used for?
Different industries use polygons, each serving a purpose in real life. Here are the notable top five:
1. Urban planning
Cities are constantly changing, so planners need reliable means for comprehending such growth and guiding it responsibly. Polygons do this by mapping out building footprints, zoning boundaries, and land-use types. In turn, they see precisely how different parts of the city function and contemplate how they may change in years to come. This spatial clarity lets them make data-driven decisions regarding density, infrastructure investments, transportation networks, and long-term development.
2. Real estate and property management
Property boundaries include attributes, such as ownership, taxes, land value, and legal rights. They outline the lots accurately, making it easier to search for property details, such as zoning allowances or value assessments, ensuring precision in property information, precluding disputes, and ensuring better investment decisions.
3. Environmental management
Knowledge of the location and changes over time in sensitive areas constitutes the basis for the protection of natural resources. Polygons map habitats, wetlands, forest cover, flood zones, and conservation areas. They help scientists and regulators monitor environmental health to make informed conservation decisions.
4. Utilities and infrastructure
Utility service territories and infrastructure assets must be organized by area to ensure safe operation and efficient service. Planners utilize polygons to map out service zones, maintenance districts, buffer zones, and asset footprints (such as solar arrays). They do this for electric, water, telecom, oil & gas, and renewable energy installations.
5. Emergency response and public safety
Polygons indicate evacuation areas, risk zones, and areas impacted by damage. They enable responders to act promptly, communicate effectively, and protect communities through targeted actions. Also, by comparing past and current mapped conditions, they make it possible to understand how these areas have changed over time and to recognize patterns that may indicate when certain events or hazards are more likely to occur.
How is polygon data created?
Connecting a series of coordinate points can be done in several ways:
- Digitisation-manual tracing: Boundaries are manually traced by GIS technicians from basemaps, satellite imagery, or photos to create new or update existing polygons. This method is very accurate for well-defined boundaries, such as property parcels.
- Photogrammetry and remote sensing: High-resolution imagery is classified into land-use types and automatically generates polygons for areas meeting specific criteria, such as built-up zones versus vegetation.
- LiDAR (Light Detection and Ranging): Aerial laser scans yield point clouds (each point has x, y, z coordinates and sometimes additional attributes like color or intensity) from which building footprints, tree canopies, and other ground surfaces can be extracted. If imagery is also acquired, then LiDAR can produce very highly accurate 3D building models.
- Data fusion: Many polygon datasets result from integrating outputs from surveys, cadastre databases, and remote-sensing sources to achieve enhanced coverage, accuracy, and reliability.
Also, surveyors and field teams who record coordinates on the ground using GPS devices or mobile mapping apps help to create polygons.
Whatever method businesses use, the result of the process will always be the same: a closed shape with accurate coordinates and polygon attributes describing the area it represents, ready for analysis and polygon mapping in a GIS.
How is polygon data stored and shared?
In general, polygon data is created, stored, and exchanged using standard GIS file formats that not only store the polygon’s shape but also its attributes. The underlying structure consists of a list of coordinate pairs that define the boundary of each polygon, along with an attribute table.
The typical formats are:
- GeoJSON holds polygons in a human-readable text structure and is perfect for web mapping.
- Shapefiles are a long-standing GIS standard that is commonly used in desktop applications.
- Geopackages are a modern, compact format that stores multiple layers with attributes in a single file.
Polygon data is also distributed via web services, such as WMS, WFS, and REST APIs. These web services allow applications to fetch live, server-hosted data without downloading files.
These formats make it easy for polygons to move between tools, systems, and organizations, whether it is for businesses to collaborate with city planners, integrate data into a web map, or analyze features in a desktop GIS. The resulting combination of polygon geometry and attributes stored in these formats ensures that polygon data is always both portable and meaningful across these platforms.
List of top polygon data providers in GIS
- Xtract.io: Provides high-quality polygon and POI datasets such as building footprints, property boundaries, retail, hospitality, public utility, and transport-related areas. Their data includes precise polygon geometry and rich attribute information, suitable for location-based analysis, marketing, urban planning, and mapping applications.
- Techsalerator: Offers comprehensive GIS and spatial data services, including polygon data, location intelligence, and custom polygon-mapping solutions for government agencies, businesses, researchers, and developers.
- Esri: The company provides commercial GIS solutions and data layers. These solutions are used across government, urban planning, utilities, infrastructure, and natural-resource management.
- East View Geospatial (EVG): Offers worldwide geospatial datasets (vector & raster), including vector polygon data, suitable for natural resources, planning, polygon mapping, and defence/enterprise needs.
- Mapbox: Provides custom polygon mapping services, vector map data, and map APIs, useful for web- or mobile-based GIS applications that need polygon/area data layers.
Conclusion
Polygon data forms one of the basic components of modern geographic information systems. Polygons enable specific analysis, visualization, and decision-making across the public, private, and academic sectors. Polygons enable targeted analysis, visualization, and decision-making across the public, private, and academic sectors. They provide the spatial precision needed to understand patterns, allocate resources, forecast impacts, and support data-driven policy and operational choices.
If you are looking for precise polygon data, xtract.io is your perfect choice.